<< Home
Graphs
The graphs on this page are created with the rerolog2gnuplot.pl
script that comes with the RERO distribution. They are built using
gnuplot.
RERO
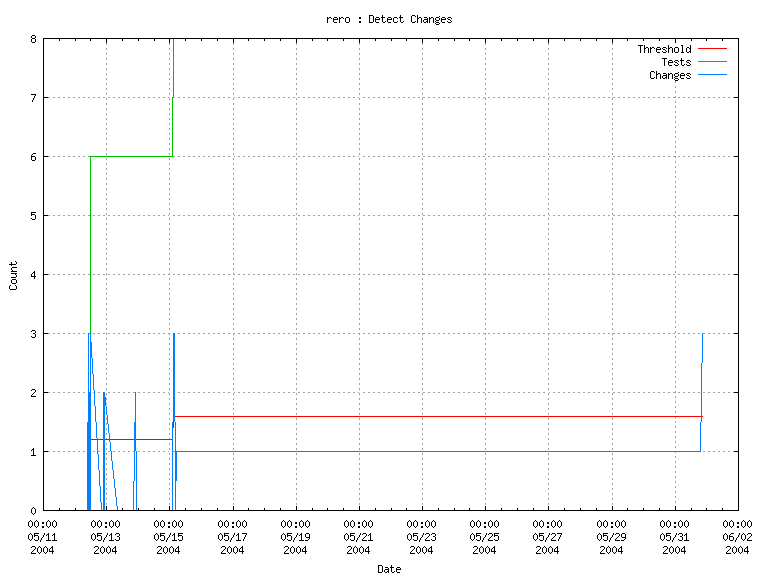
The first graph shows the progress of the “Detect Changes” step. The second graph shows the timings for each step in the release process.
Change Detection
Timings
